See what video does to your revenue
Storista compares the shoppers who watched your videos with the shoppers who didn't — conversion rate, average order value and revenue per visitor, on a purchase window you choose. Not just views and watch time.
Works with any Shopify theme. No developer needed.
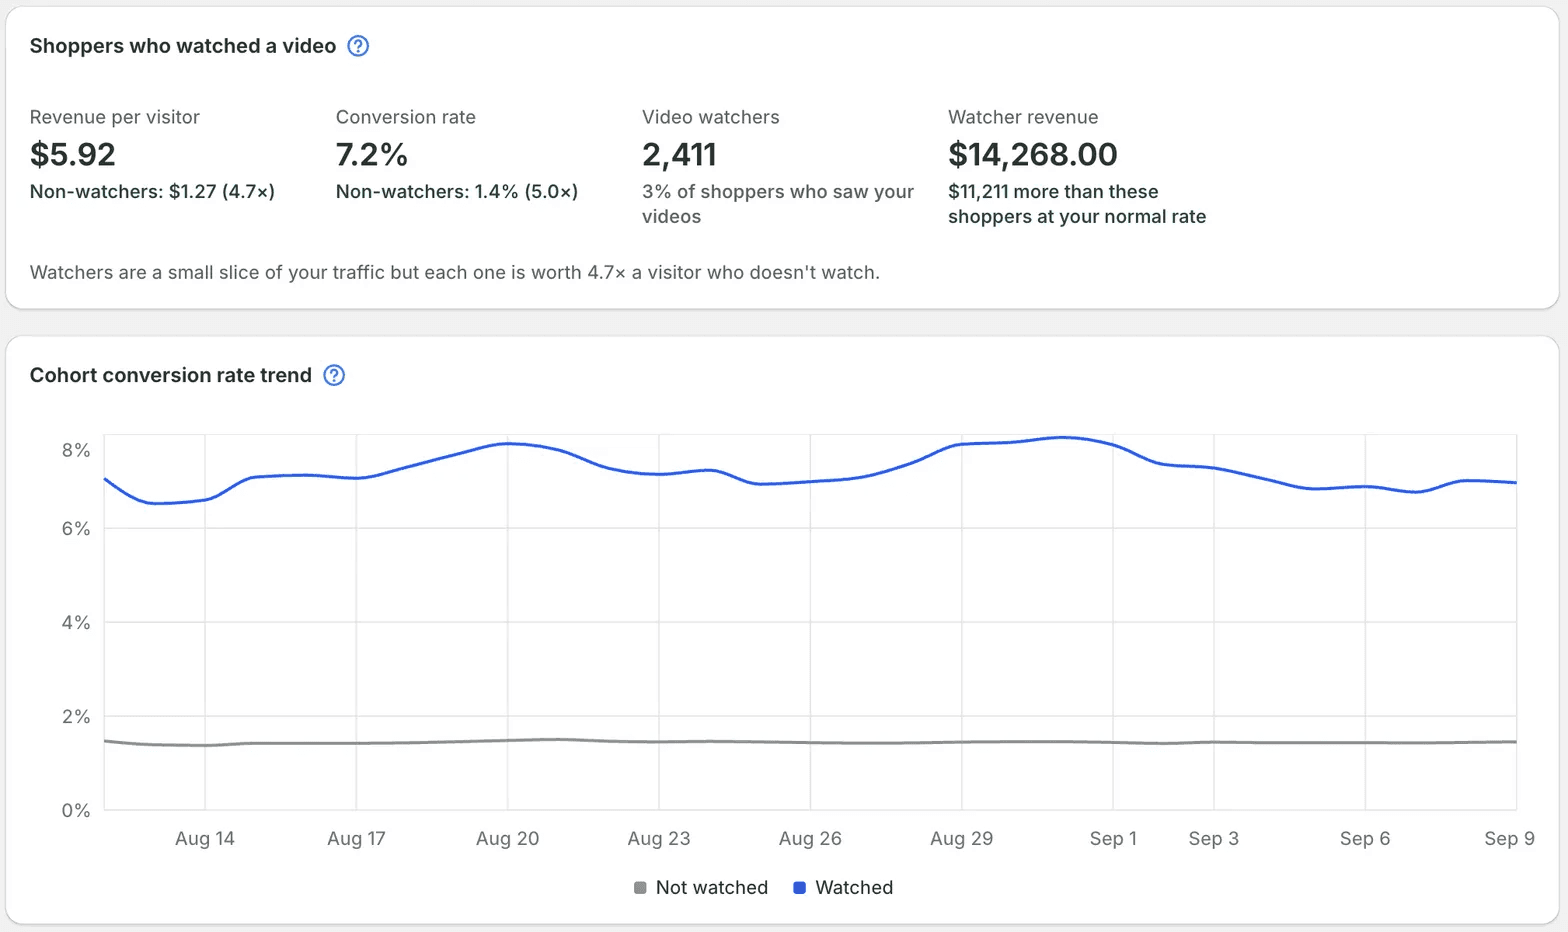
Video analytics for Shopify: turning plays into revenue
Impressions, plays, clicks and watch time show that shoppers see your videos. They say nothing about whether those shoppers go on to spend more, and that is exactly what finance teams want to know when a subscription comes up for renewal. Most video apps count only the orders they can claim credit for. Storista tracks every order in the store, including orders from shoppers who never watched anything.
With the full order history in view, video analytics for Shopify can answer the revenue question directly. You find out:
- how conversion rate changes once a shopper has watched a video
- whether revenue per visitor is higher among shoppers who watched
- which Instagram Reels, TikTok clips and UGC videos lead to sales
How Shopify video analytics works
Installing Storista adds two components at once: the video widget and a Shopify web pixel. Nothing else has to be set up. The integration works with any Shopify theme, and data collection starts right away.
1. Video engagement
The widget records when a shopper sees your content, plays a video for 3 seconds, opens the fullscreen player, or taps add-to-cart.
2. Every order
A Shopify web pixel reports each completed order and its value — all of them, not only video-attributed ones.
3. The comparison
An anonymous browser identifier links the two, so we can show what watchers were worth against everyone else on your store.
This is how Shopify video analytics in Storista matches engagement with actual sales. Names and email addresses are never collected, and no data is shared between stores.
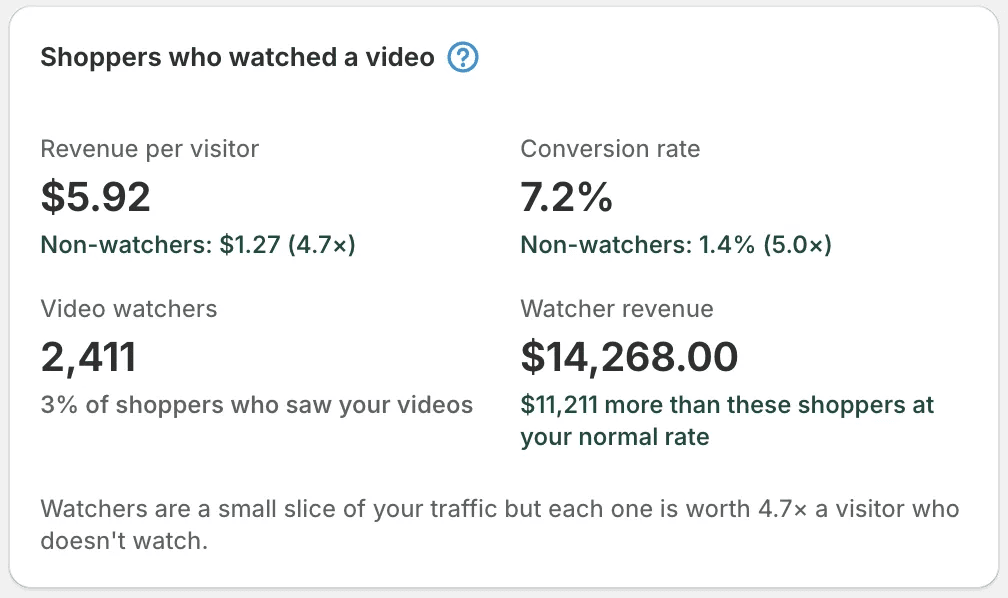
Watchers vs everyone else
- revenue per visitor
- conversion rate
- number of watchers
- total revenue from watchers
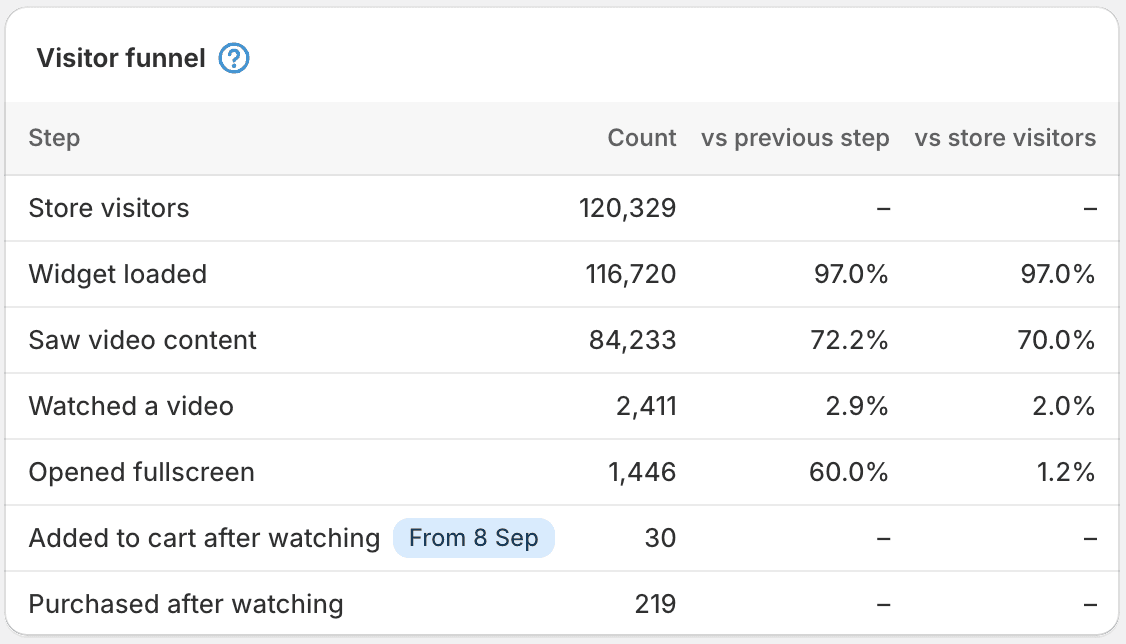
Find the step that's costing you
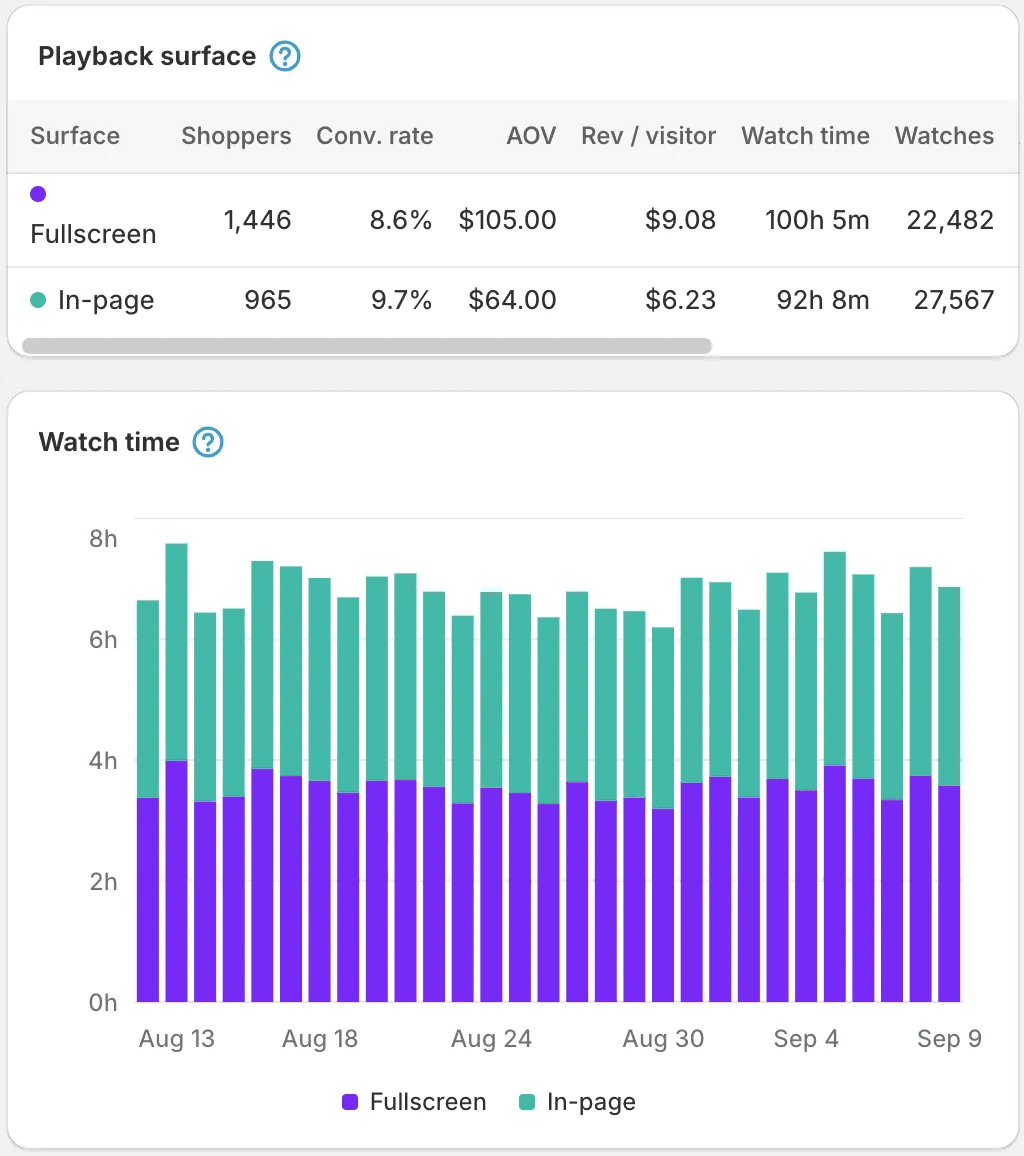
In-page reach, fullscreen value
Know what to make next, and where to put it
Everything included
The full metric set
Revenue
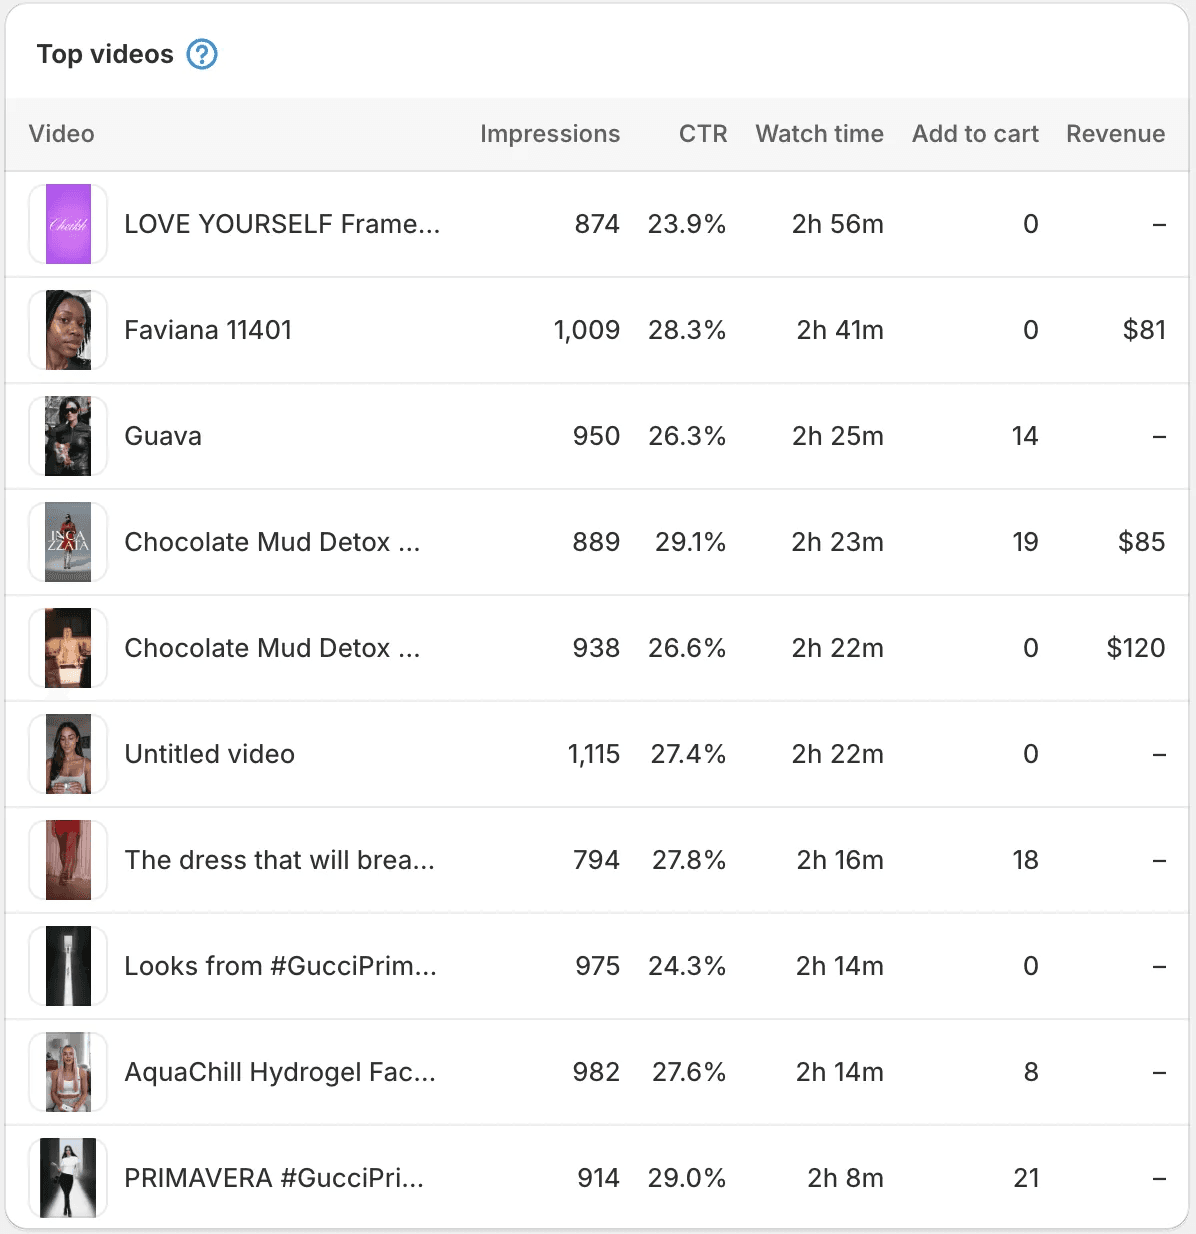
Revenue per visitor, average order value, orders, and revenue attributed to specific widgets and videos — direct and influenced.
Engagement
Impressions, unique shoppers, click-through rate, visibility rate, fullscreen open rate, watch time, average watch time and completion rate.
Intent
Add-to-cart clicks, unique shoppers who added, add-to-cart rate on product-tagged videos, and buy-now taps counted separately.
Segments
Mobile vs desktop on every metric, fullscreen vs in-page playback, and performance for visitors arriving from ad campaigns.
Time
Any date range, 1/7/30-day purchase windows, daily trends, and clear marking of days still collecting purchases.
Per widget, per video
Every metric again at the placement level, plus a per-video breakdown inside each widget.
What we don't claim
Straight answers about the numbers
Watchers aren't a random group
Shoppers choose whether to watch, so the two groups were never alike to begin with. Someone who stops for a product video usually arrived interested. What you get here answers a practical question: are the shoppers who engage with your videos worth more? That's enough to decide where to put videos and what to film next. It doesn't prove the video caused the sale.
Our numbers won't match Shopify or Meta exactly
Every platform counts on a different basis. Shopify counts by order date. Ad platforms credit clicks and views inside their own windows. We count by the day someone engaged with your video. Expect the same story in all three, with different figures attached. For total revenue, Shopify is the number to trust.
Average order value usually barely moves
Video tends to change how often people buy rather than how much they spend per order. We put watcher and non-watcher AOV side by side instead of turning them into a flattering ratio. For most stores they end up close, and that's worth seeing plainly.
Recent days are incomplete on purpose
With a 30-day window, yesterday has had one day to collect purchases and will keep climbing for the next month. We flag those days so the dip doesn't read as real.
Questions merchants ask
What counts as a watched video?
Do I need to install anything beyond the app?
How long until the numbers are useful?
Is any personal data collected?
What if my store doesn't have much traffic yet?
Does this work with my theme?
Still stuck?
Find out what your videos are worth
Install free, and see your first comparison within a week.
Figures on this page are measured across Storista merchant stores over 92 days, using stores with enough traffic for a reliable comparison. Medians across stores; individual results vary.